When It Comes to Poverty, How Does Hawaii Compare?
Pretty well. Poverty levels are on the rise especially in the South.
North Carolina and several other Southern U.S. states “saw the biggest increases” in the number of people living in “poverty areas” between 2000 and 2010, according to a new Census Bureau report.
“Poverty areas are places where more than 20 percent of the people live below the federal poverty line, which varies by family size,” according to this article in The Huffington Post. “For a family of four, the poverty line in most states is an annual income of $23,850.
Today, 25.7 percent of all Americans “live in such areas,” says HuffPo, up from 18.1 percent in 2000.
The first map shows how poverty rise rates compare across the country:
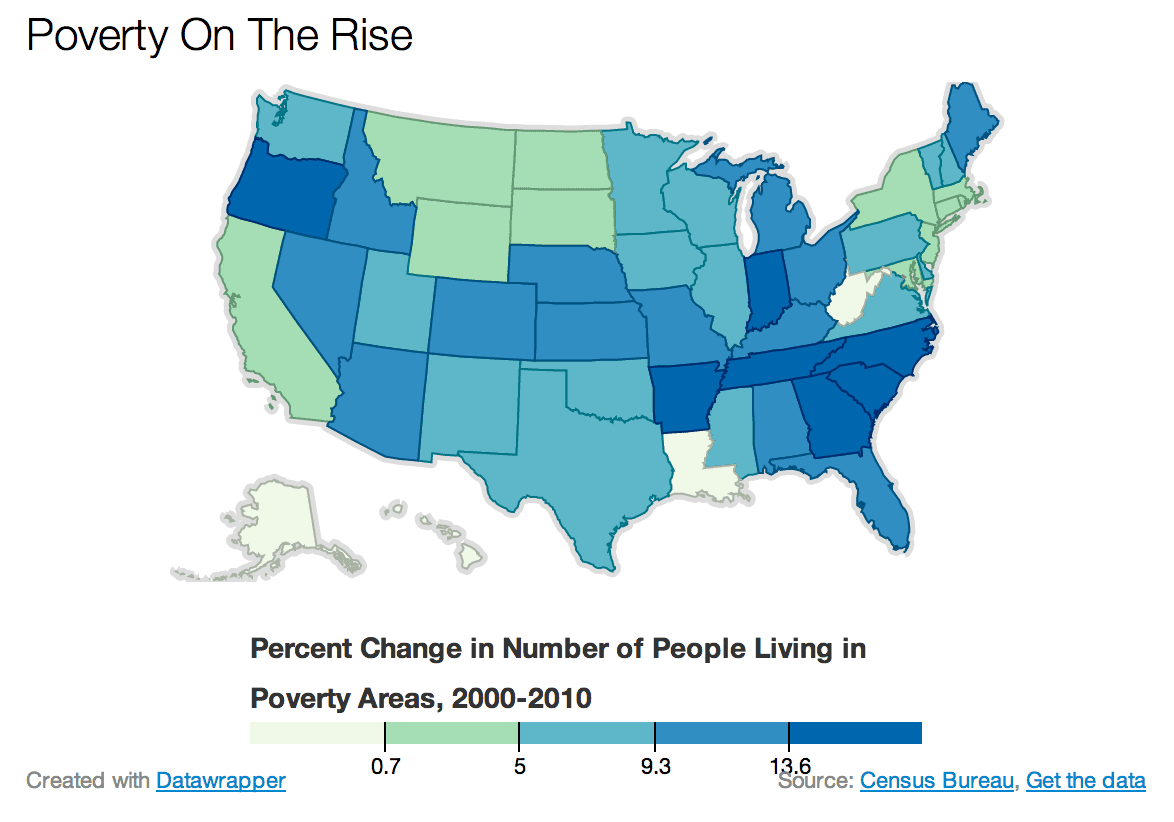
U.S. Census Bureau
Note that Hawaii appears to have done better than most states in this data.
“Bucking the trend, two Southern states, Louisiana and West Virginia, actually saw the number of people living in poverty areas shrink during the decade,” says HuffPo.
The second map shows percentages of poverty per state according to the Census. Again, Hawaii fairs decently:
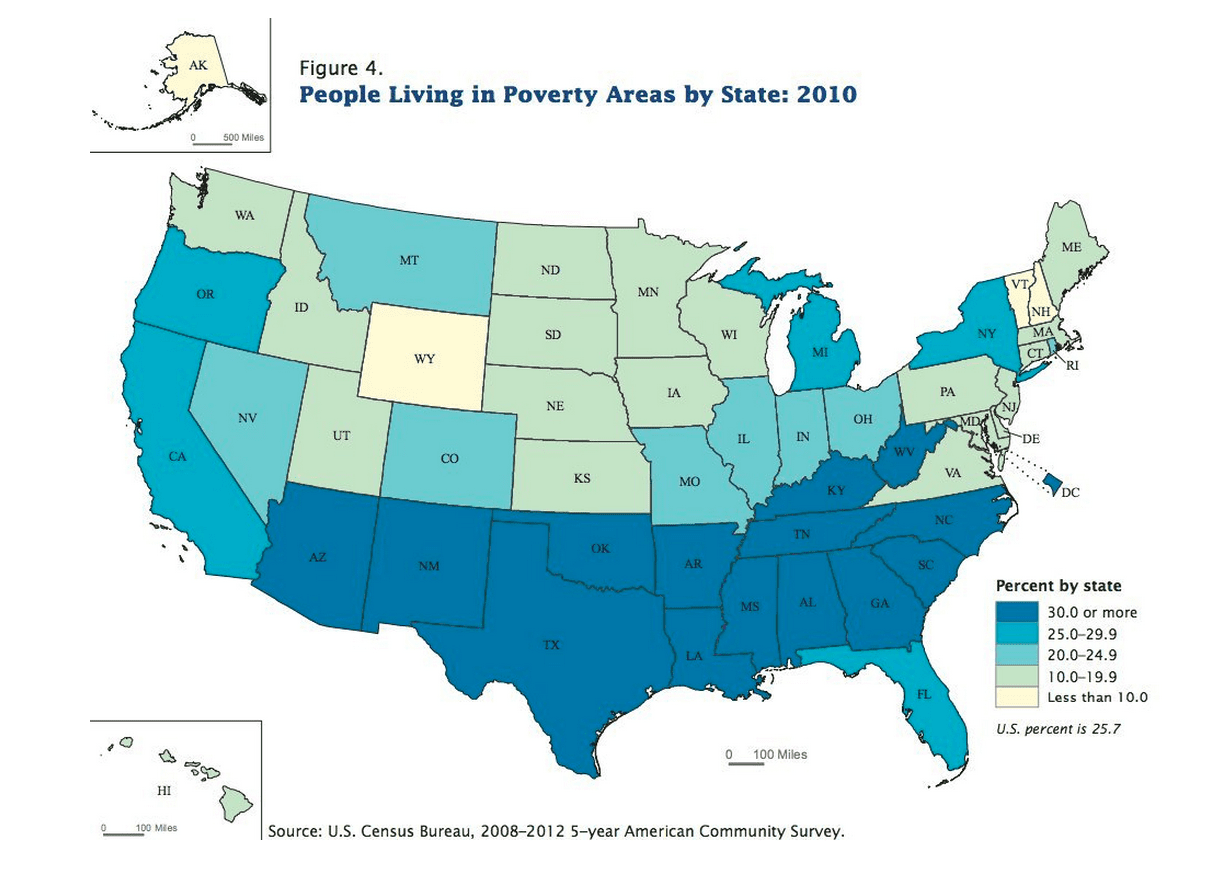
U.S. Census Bureau